Delta Divergence Indicator
$49 $0
Yours for Free. With a Lifetime License. Go Trade Well.
How the Indicator Operates
The DeltaDivergence indicator is a NinjaTrader technical indicator that analyzes cumulative delta (the net difference between buying and selling pressure from order flow data) to identify divergences between price action and market participation. It uses multiple EMAs on the cumulative delta and compares price extremes against delta trends to generate trading signals.
The indicator prioritizes EMA-based divergences as the most reliable signals, followed by EMA crossovers, with direct price-delta comparisons as the final check. This hierarchy ensures the most sophisticated analysis gets precedence in signal generation.
Core Components
- Primary Data Source: Order flow cumulative delta (bid-ask based, session-period)
- Technical Analysis: EMAs of cumulative delta (fast 8-period, slow 21-period default)
- Signal Generation: Three types of divergences with priority-based detection
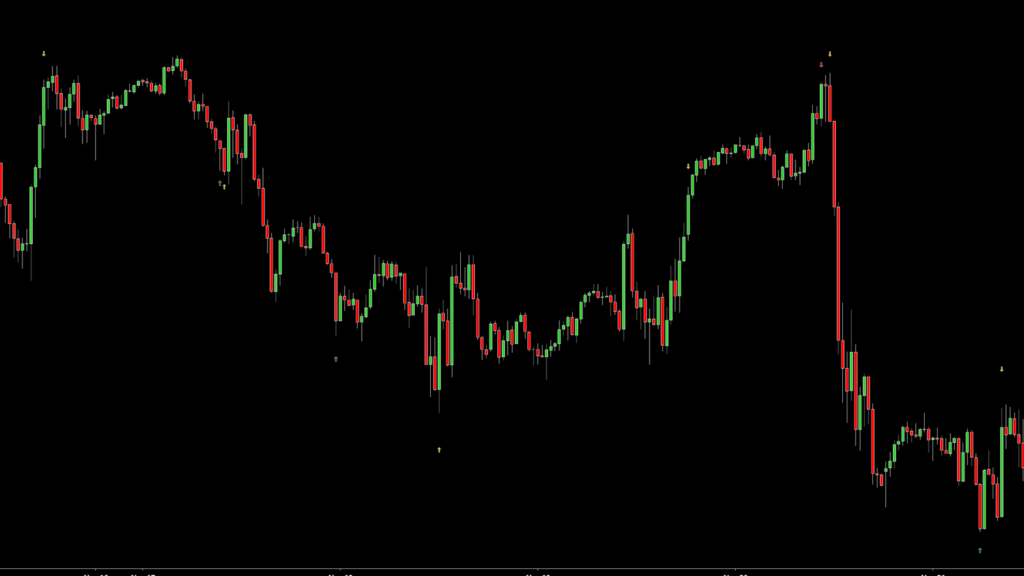
- Display: Visual signals drawn on price charts as arrows and diamonds
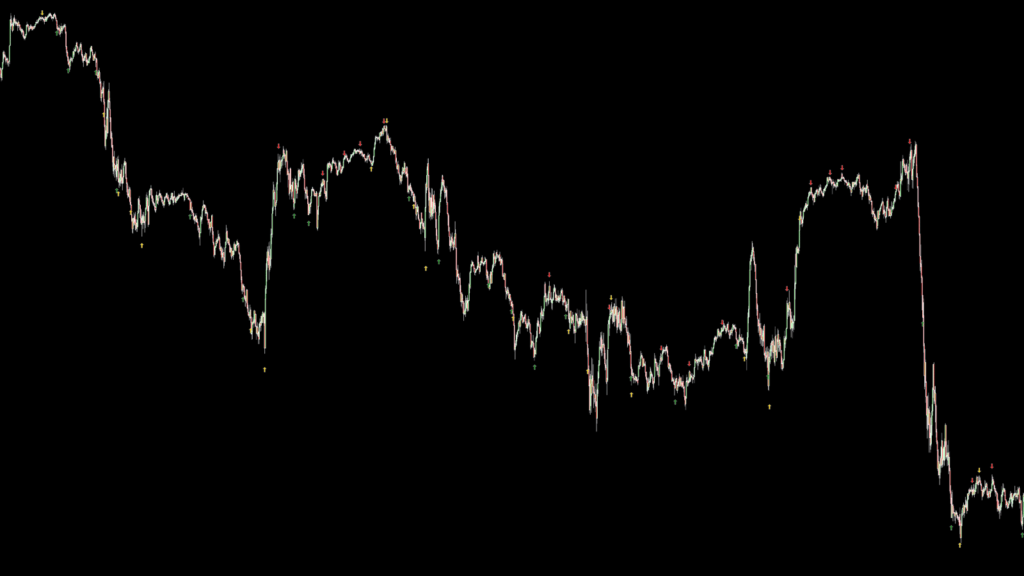
Signal Legend
Priority 1: EMA-Based Divergences (Gold/Yellow Arrows)
Color: Gold
Symbol: Up arrow (↑) for bullish, Down arrow (↓) for bearish
Logic: Compares price extremes against delta EMA8 trend direction
- Bullish Yellow Up Arrow: Price makes lower low, but delta EMA8 is rising → Signal buying pressure strengthening despite price weakness
- Bearish Yellow Down Arrow: Price makes higher high, but delta EMA8 is falling → Signal buying pressure weakening despite price strength
Priority 2: EMA Crossover Signals (Blue Diamonds)
Color: Blue
Symbol: Diamond (◆)
Logic: Detects crossovers between fast and slow delta EMAs at price extremes
- Bullish Blue Diamond: Fast EMA crosses above slow EMA while price hits new low → Signal accelerating buying momentum
- Bearish Blue Diamond: Fast EMA crosses below slow EMA while price hits new high → Signal accelerating selling momentum
Priority 3: Price-Delta Divergences (Colored Arrows)
Logic: Direct comparison between price swings and delta extremes
- Bullish Green Up Arrow: Price hits new low but delta hits new high → Signal strong buying at lows
- Bearish Red Down Arrow: Price hits new high but delta hits new low → Signal strong selling at highs
Configurable Parameters
Lookback Period (Default: 55)
Range: User-defined integer
Purpose: Determines how far back the indicator looks to find price and delta extremes for comparison
Configuration: Increase for longer-term analysis (e.g., 100+ for daily charts), decrease for shorter-term (e.g., 20-30 for intraday)
Why adjust: Longer periods reduce false signals but may miss short-term opportunities; shorter periods increase sensitivity but may generate more noise
Fast EMA Period (Default: 8)
Range: 5-50
Purpose: Period for the fast EMA applied to cumulative delta
Configuration: Shorter periods (5-10) make it more responsive to recent delta changes; longer periods (15-25) smooth out delta noise
Why adjust: Faster EMA increases signal frequency for scalping; slower EMA reduces whipsaws for trend-following
Slow EMA Period (Default: 21)
Range: 10-100
Purpose: Period for the slow EMA applied to cumulative delta
Configuration: Should generally be 2-3x the fast EMA period; increase for major timeframe analysis
Why adjust: Wider gap from fast EMA creates fewer but more significant crossover signals; narrower gap increases crossover frequency
Minimum Bars Between Signals (Default: 5)
Range: 0-50
Purpose: Prevents signal clustering by enforcing minimum spacing between consecutive signals
Configuration: Set to 0 for maximum signals; increase to 10-20 for cleaner, less frequent signals
Why adjust: Higher values reduce overtrading in volatile markets; lower values capture more opportunities in trending markets